St. Charles Trading: Transforming Financial Reporting with Power BI Analytics
How a trusted food ingredient distributor resolved data integrity issues and unlocked actionable insights with advanced analytics
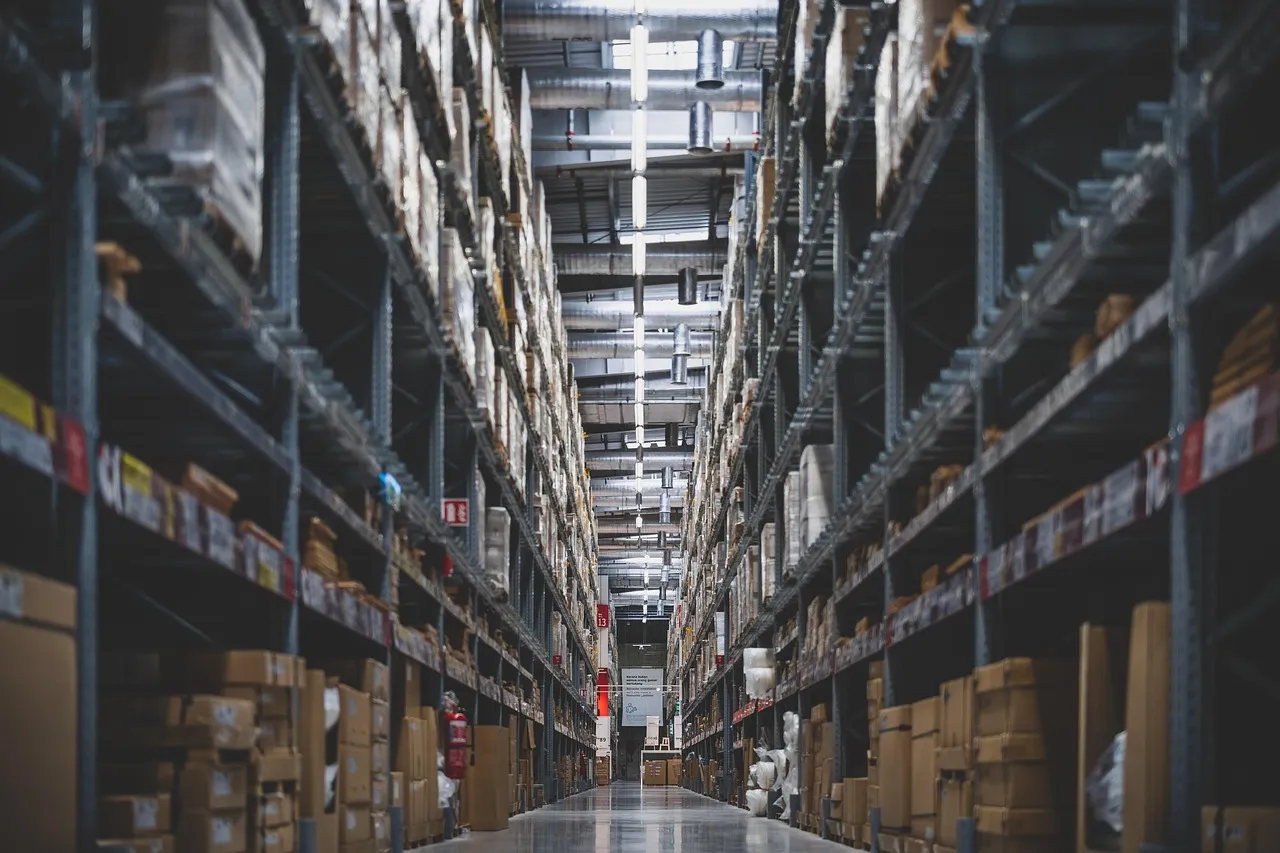
St. Charles Trading, Inc. has built a strong reputation as a trusted food ingredient distributor, committed to providing high-quality products and personalized service. With decades of industry experience, their dedicated team works closely with clients—offering expert advice, detailed spec sheets, samples, and competitive pricing—to ensure every customer's needs are met with precision and care.
Visit stcharlestrading.com ↗- Industry
- Food Ingredient Distribution
- Headquarters
- St. Charles, Illinois
- Reach
- National Distribution
- Specialty
- High-Quality Food Ingredients
Data Integrity & Reporting Gaps
St. Charles Trading faced significant challenges with their financial reporting and analytics capabilities. Without reliable data and robust reporting tools, the company struggled to make informed, data-driven decisions.
Data Integrity Issues
The existing system struggled to generate accurate financial reports with discrepancies in key financial figures.
Incorrect Financial Reporting
Critical financial documents such as P&L reports, dashboards, and document management were not meeting expectations.
Lack of Reporting & Analytics
Without robust reporting tools, the company found it difficult to gain insights for data-driven decisions.
Limited Strategic Visibility
Without analytics capabilities, they were missing critical insights to optimize operations and identify growth opportunities.
Solutions and Key Steps Taken
A phased approach to analytics transformation, from discovery to full deployment.
- 01
Digital Innovation Workshop & Opportunity Identification
DiscoveryStrategyRoadmapCaptivix conducted a comprehensive workshop with St. Charles Trading's leadership to assess existing data challenges and identify opportunities for analytics-driven improvement. This session focused on:
- Data Analysis: Evaluating the integrity of financial data and identifying gaps in reporting
- Technology Selection: Determining effective tools and platforms to address existing issues
- Infrastructure Evaluation: Assessing current systems for compatibility with advanced analytics
Outcome: From this workshop, a structured analytics roadmap was developed, focusing on Power BI deployment, data governance, and predictive capabilities.
- 02
Technology Stack & Solution Implementation
Power BIPredictive AnalyticsData GovernanceWith a clear roadmap in place, Captivix executed a comprehensive analytics implementation tailored to St. Charles Trading's needs:
- Power BI Implementation: Deployed Power BI for advanced, real-time dashboards
- Real-Time Financial Reporting: Enhanced P&L reports, balance sheets, and financial dashboards
- Advanced Business Intelligence Dashboards: Interactive dashboards for inventory, sales, and KPIs
- Predictive Analytics for Demand Forecasting: Historical sales data to forecast future demand
- System Integration: Seamless Power BI integration with existing enterprise systems
- Enhanced Data Governance: Data validation processes and regular audits for integrity
Outcome: The implementation achieved 100% accurate financial reporting with real-time BI dashboards, transforming how leadership accesses and acts on business data.
Measurable Results
Transformative outcomes that speak to the power of advanced analytics and data governance.
Accurate Financial Reporting
Automated processes and real-time data eliminated discrepancies in financial reports.
Business Intelligence
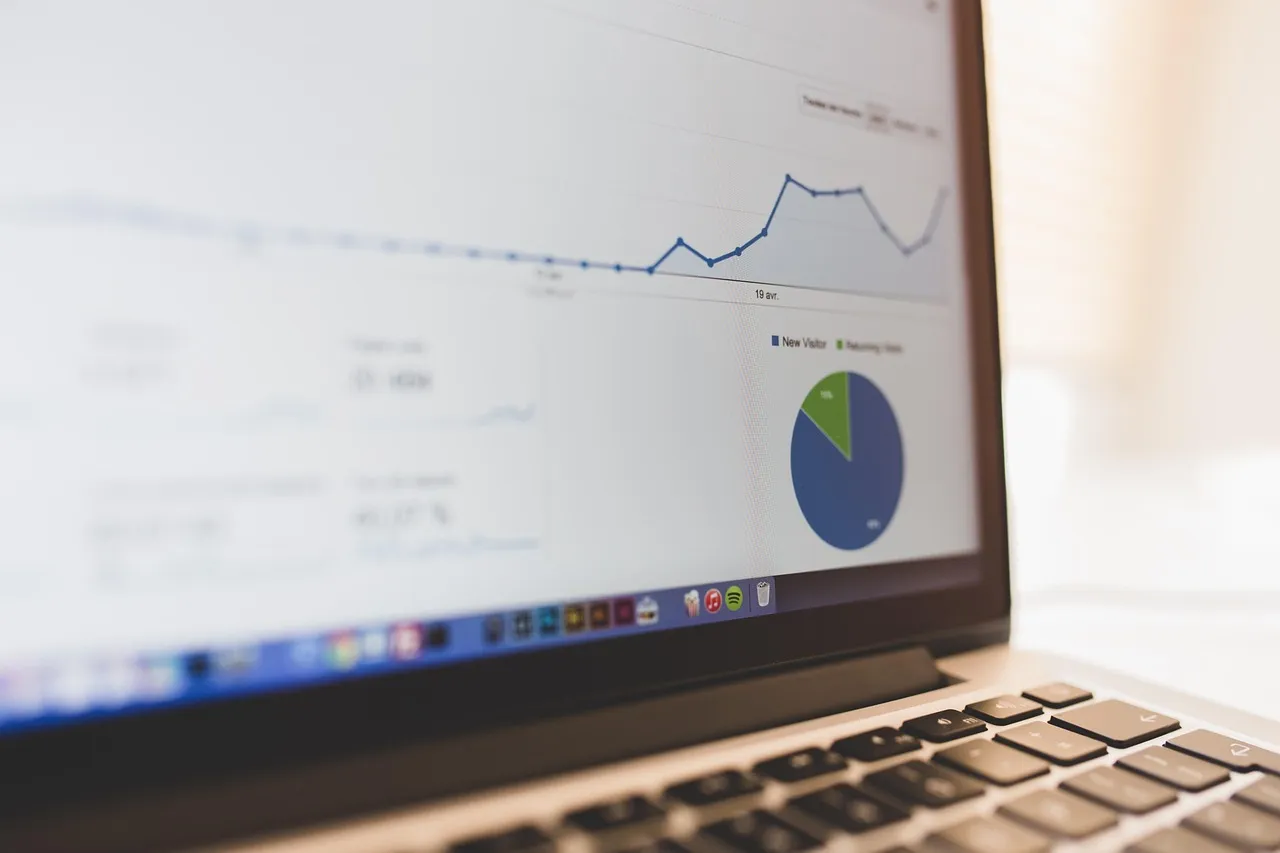
Interactive Power BI dashboards provide leadership with clear, actionable insights.
Demand Forecasting
The company now forecasts demand accurately, optimizing inventory and procurement.
Operational Efficiency
Reduced manual interventions allow the team to focus on growth and customer service.
Our core system delivers excellent performance, but without robust analytics capabilities we were missing critical insights that would optimize operations, identify growth opportunities, and strengthen our competitive position. Captivix transformed our reporting capabilities entirely.
Technologies & Tools Used
The technology ecosystem powering St. Charles Trading's analytics transformation.
Conclusion & Future Vision
St. Charles Trading's successful analytics transformation eliminated data integrity issues and unlocked powerful business intelligence. Moving forward, the company aims to:
Expanded Analytics
Extend Power BI capabilities to additional business functions and departments.
AI-Powered Forecasting
Enhance predictive models with machine learning for more accurate demand planning.
Data-Driven Growth
Use analytics insights to identify new market opportunities and optimize distribution.
- Project Duration
- Focused analytics implementation with ongoing support
- Scope
- Power BI deployment, financial reporting enhancement, predictive analytics, and data governance
- Outcome
- 100% accurate financial reporting with real-time BI dashboards and predictive forecasting
Explore how other companies have transformed with Captivix
Frequently Asked Questions
How long do these projects typically take?
Project timelines vary based on scope and complexity. Most implementations range from 3 to 12 months, with our team working closely with yours to define clear milestones and deliverables from day one.
Can you work with our existing systems?
Absolutely. We specialize in integrating with existing ERP, CRM, and operational tools including Dynamics 365, SAP, Salesforce, and custom applications. Our approach builds on your current infrastructure rather than replacing it.
What kind of ROI can we expect?
ROI varies by project, but our clients typically see measurable improvements within the first 90 days. Common outcomes include 30-60% reduction in manual processes, improved data accuracy, and significant cost savings across operations.
Do you offer ongoing support after implementation?
Yes. We provide comprehensive post-implementation support including system monitoring, user training, optimization services, and dedicated account management to ensure long-term success.
How do we get started?
Book a demo with our team. We'll review your current challenges, discuss potential solutions, and outline a clear path forward — whether that's a focused deployment, full implementation, or strategic consultation.
Ready to Achieve Similar Results?
Let's discuss how we can help transform your operations with the right technology and strategy.